Chapter2 Frequency Distributuions
2.1 Frequency Distributions and Frequency Distribution Tables
- Purpose of Descriptive Statistics: Summarize and describe large quantities of data
기술 통계의 목적은 많은 양의 자료(data)를 설명하고 요약하기 위함이다. - Frequency distribution: an organized tabulation of the number of individuals located in each category on the scale of measurement
도수 분포: 측정 척도에서 각각의 범주에 존재하는 개체의 수를 목록, 표, 그래프로 정리한 것
//One of the most common procedures for organizing a set of data is to place the scores in a frequency distribution
- categories 범주[카테고리]
- Frequency/number of people 사람의 수/빈도
- Rules
- Transfrom information into more recognizable data
- Group data into categories
- Show the number of observations in each category
- from highest to lowest
- grouping together individuals who all have the same score
- Either a table or a graph, Distribution presents the same two elements:
- The set of categories that make up the original measurement scale.
- A record of the frequency, or number of individuals in each category.
EXAMPLE 2.1 )
The following set of N = 20 scores was obtained from a 10-point statistics quiz. We will organize these scores by constructing a frequency distribution table. Scores:
8, 9, 8, 7, 10, 9, 6, 4, 9, 8,
7, 8, 10, 9, 8, 6, 9, 7, 8, 8
| X | f (frequency) |
| 10 | 2 |
| 9 | 5 |
| 8 | 7 |
| 7 | 3 |
| 6 | 2 |
| 5 | 0 |
| 4 | 1 |
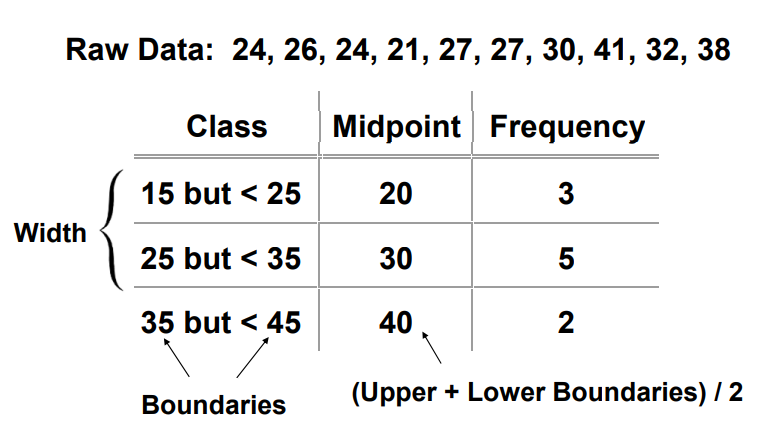
2.2 Grouped Frequency Distribution Tables
그룹화된 도수분포표 score를 일정간격으로 끊어서 단위처럼 만든다.
EXAMPLE 1 in PPT)
- Midterm exam scores : unorganized
- First, identify the lowest and highest values in the list
- Lowest value:
- Highest value:
- Categorize numbers into equal sized groups(class)
91 85 76 85 87
79 93 82 75 100
70 88 78 83 59
87 69 89 54 74
83 80 94 67 77
92 82 70 94 84
96 98 46 70 90
96 88 72 66 79
| Class | Frequency |
| 41-50 | 1 |
| 51-60 | 2 |
| 61-70 | 6 |
| 71-80 | 8 |
| 81-90 | 14 |
| 91-100 | 9 |
- Category/Class: mutually exclusive (no overlap) //상호배타적: 교집합이 없어야 한다는 의미임
- Equal sized category //범주(카테고리)는 같은 크기여야 한다. 같은 단위로 끊어야함
- Avoid open-ended classes (75 and over) //개방된 범주는 피해라
- Should have 5 to 15 classes and class interval should be 2, 3, 5 or a multiple of 5
//5~15개의 class가 있어야 함. 그 간격은 2,3,5, 혹은 5의 배수여야 함
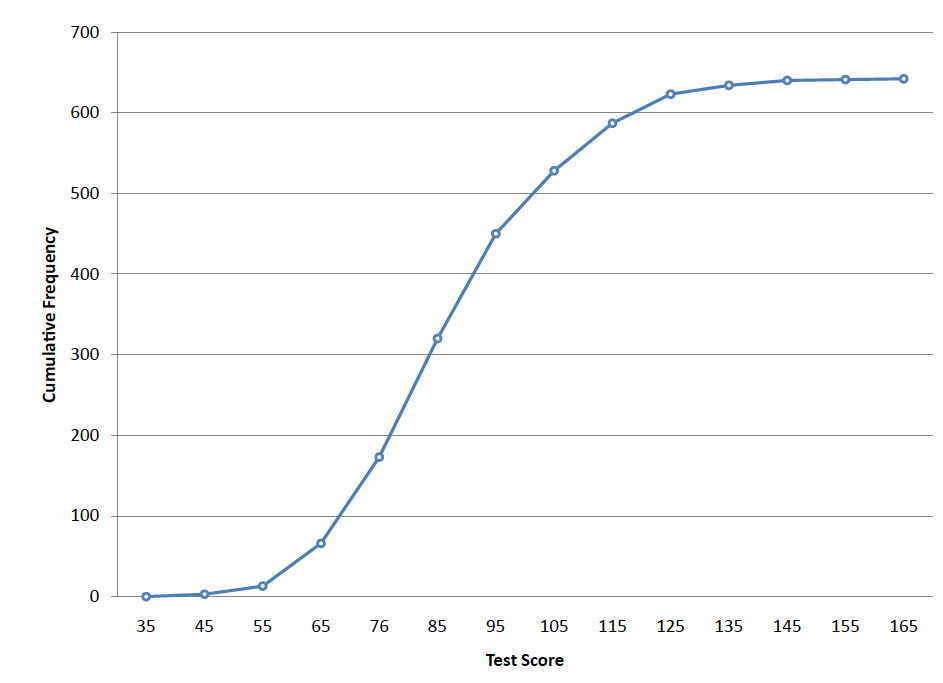
Cumulative Frequency Distributions 누적도수분포표
Start with the lowest score in the distribution and form a new column of cumulative frequencies by adding up the frequencies as you go up
분포의 가장 작은 score 부터 시작하여 다음 누적도수를 만들 때 이 전의 것을 계속 더해나간다.
EXAMPLE 2 in PPT)
| Class | Frequency | Cumulative Frequency |
| 41-50 | 1 | 1 |
| 51-60 | 2 | 3 |
| 61-70 | 6 | 9 |
| 71-80 | 8 | 17 |
| 81-90 | 14 | 31 |
| 91-100 | 9 | 40 |
2.3 Frequency Distribution Graphs
Graphic Presentation 시각적 표현
- Histogram (Bar graph)
- Stem-and-Leaf Displays
- Freauency Polygons
- Cumulative Frequency Polygons
Histogram 막대그래프..

- Y 축(수직축): 빈도수, 개수
- X 축(수평축): 응답, score
- Ex) NYC police officer's number of arrests made per month
- Condenses data by grouping similar values into classes in a graph
- May show frequencies (counts)
- Must first develop a frequency distribution table


2.4 Stem and Leaf Displays
Stem and Leaf Displays
• combination of frequency distribution and the histogram
EXAMPLE in PPT)
• The lowest age is 17, and the highest age is 41. The stem for 17 is 1, and the stem for 41 is 4
22 19 30 21 41 24 19 23 27 32 30 20
22 36 24 26 39 20 21 19 19 19 22 30
31 17 18 21 26 21 25 21 22 22 20 40
23 19 21 17 20 33 22 31 19 24 37 2
| Stem | Leaf |
| 1 // stem for 17 | 7 7 8 9 9 9 9 9 9 9 |
| 2 | 0 0 0 0 1 1 1 1 1 1 2 2 2 2 2 2 2 2 3 4 4 4 5 6 6 7 |
| 3 | 0 0 0 1 1 2 3 6 7 9 |
| 4 //stem for 41 | 0 1 |
//7 in stem of 1 =17
//0 in stem of 2 = 20
Frequency Polygons 도수분포다각형
- the frequency of a score is expressed by the height of the graph above the X axis

Cumulative Polygons 누적도수분포다각형
- always remain level or increases and can never drop down toward the X axis
Shapes of a Frequency Distribution 도수분포표의 모양
- Symmetry
- 가장 중앙값의 빈도수가 높음. 극단으로 갈 수록 빈도수가 낮아짐.
- 중앙에 수직선을 그으면 대칭을 이룬다.
- Skewness
score가 한쪽 끝으로 갈수록 높아지고 다른 한 쪽 끝으로 갈 수록 작아지는 모양- tail of distribution
: 도수가 높아 유난히 튀어나온 score에서 멀어지면서 점점 도수가 작아지는 곳을 꼬리라고 함. - positively skewed (skewed to the right) : tail 꼬리가 오른쪽으로 감
- negatively skewed (skewed to the left) : tail 꼬리가 왼쪽으로 감
- tail of distribution

Not all distributions are perfectly symmetrical or obviously skewed in one direction.
Therefore, it is common to modify these descriptions of shape with phrases likely "roughly symmetrical" or "tends to be positively skewed.".
The goal is to provide a general idea of the appearance of the distribution.
- Modality : number of clearly distinguishable high points or “peaks” in a distribution
- ex) unimodal distribution, bimodal distribution, multimodal distribution
순서대로 솟아오른 기둥(피크)가 하나, 둘, 여러 개...인 분포
- ex) unimodal distribution, bimodal distribution, multimodal distribution
'2021-가을학기 > 심리통계분석 I' 카테고리의 다른 글
| [Chapter 5] z-Scores: Location of Scores and Standardized Distribution (2) | 2021.10.13 |
|---|---|
| [Chapter 4] Variability 변산성 (0) | 2021.10.13 |
| [Chapter 3] Central tendency (0) | 2021.10.13 |
| [Chapter1] Introduction to Statistics (0) | 2021.10.12 |
| [교재] Preface - Statistics for the behavioral Sciences (0) | 2021.10.11 |